
Incremental dynamic analysis for seismic fragility analysis
Published:
A vital component of the performance-based earthquake engineering (PBEE) is the so-called fragility function. In this post, I will discuss one method to calculate the fragility function using incremental dynamic analysis. A simplified single degree-of-freedom (SDOF) system is analysed in OpenSeesPy to illustrate the steps in determining the fragility function.
Seismic fragility function
One of the advantageous feature of PBEE is the transparent accounting of uncertainty in the design or assessment process. While the PBEE framework has evolved over the years, its original inception as part of the Pacific Earthquake Engineering Research (PEER) studies partitioned seismic assessment into four distinct analyses: seismic hazard, structural response, damage, and loss, while accounting for various levels of uncertainties at each step. The PBEE framework provides a sequential methodology that maps seismic hazard to eventual impacts that the stakeholders can use for decision-making.
The seismic hazard analysis, typically performed probabilistically, is characterized by an intensity measure (IM), which quantifies the severity of an earthquake scenario. Examples of IM include peak ground acceleration (PGA), first-mode spectral acceleration $S_a(T_1)$ or 1-sec spectral acceleration $S_a(1 s)$. Seismic hazard curves which is derived by performing Probabilistic Seismic Hazard Analysis (PSHA) describes the annual rate of exceeding certain levels of ground-motion shaking (expressed in terms of IM) at a specific site. The seismic hazard curve integrates the frequencies of all potential earthquake rupture scenarios (from a seismic source model) with the probability distribution of shaking intensity predicted for each scenario (from a ground-motion model). An example of seismic hazard curve is shown below (adapted from [1]).
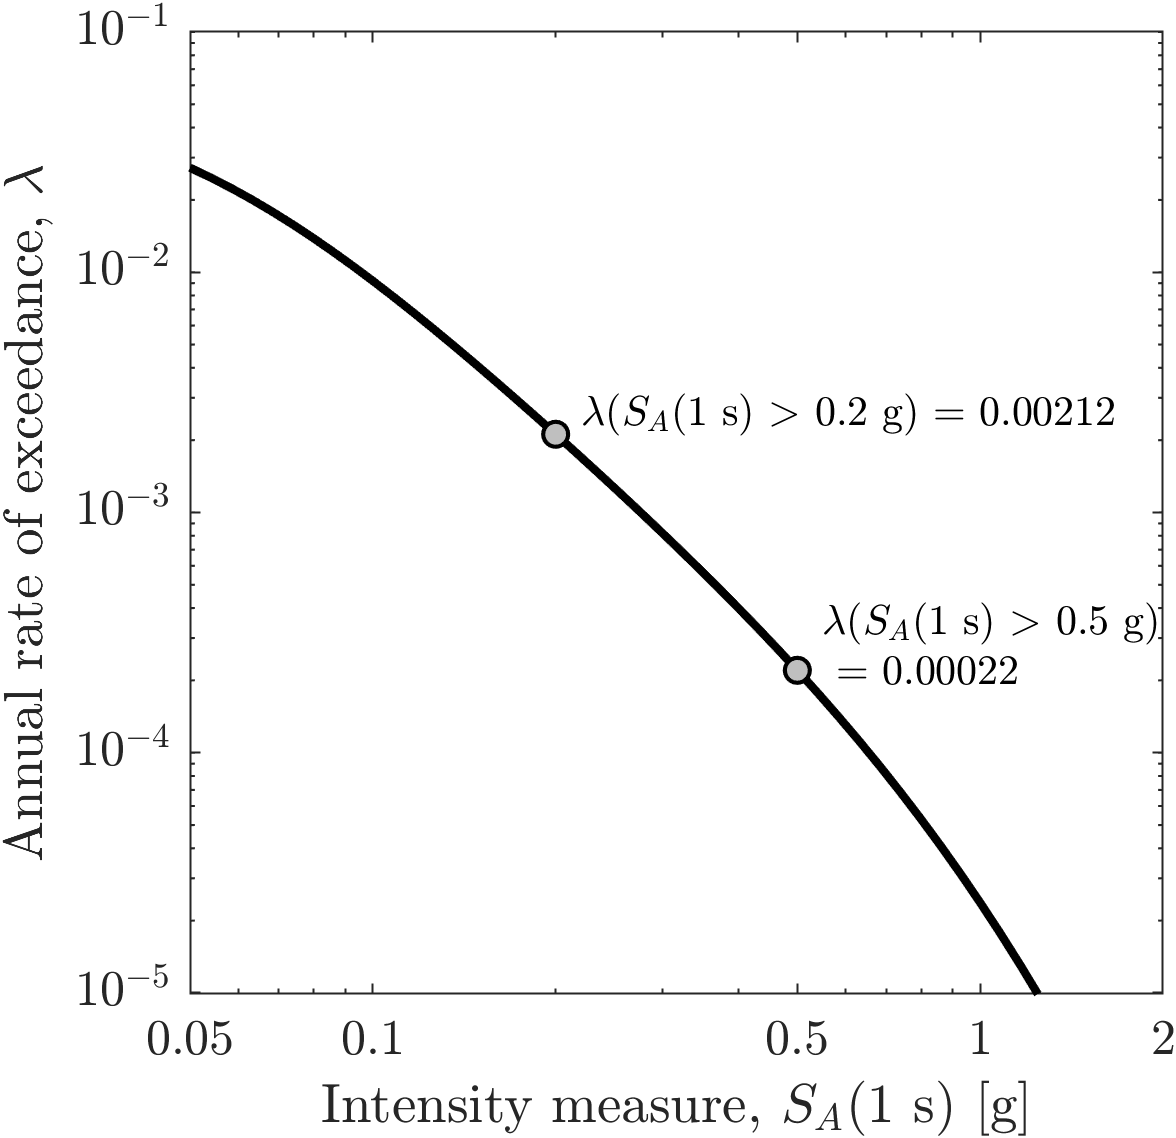
When PBEE is used for design of new buildings, the annual rate of exceedance $\lambda$ (or its equivalent return period) is prescribed by building codes and standards. The target return period is then used to determine its corresponding IM based from the sites’s hazard curve. In the PBEE framework, the uncertainty in the seismic hazard is propagated to the structural response, damage and loss.
The response of a structure to seismic loading can range from no damage to complete failure of individual components or the entire structural system; thus, the extent of structural damage is a continuous parameter. To discretize the degree of damage to distinct damage states (DS), limit states (LS) are defined. Damage states such as slight, moderate, extensive or complete damage are typically characterized by an engineering demand parameter (EDP) (e.g., interstory drift, plastic rotation, etc.). While damage states represents the physical condition of the structure, the broader terminology used in PBEE is peformance level (e.g., Operational, Immediate Occupancy, Life safety, Collapse prevention) which encompasses not only physical attributes but also safety, functionality, reparability and downtime. A pair of annual rate of exceedance and specific damage state or performance level comprises a performance objective, that is, given X seismic hazard level (e.g. 2% in 50 years), a Y performance level (e.g. Life safety) should be achieve. This is one reason why it is called performance-based design/assessement.
In PBEE framework, the fragility analysis basically connects the hazard analysis and structural response analysis. Fragility function is defined as the probability of violating LS given a value of earthquake intensity measure.
\[F_{LS} (IM) = \Pr(C\leq D |IM)\]The limit state function is violated when the structures capacity is exceeded by the demand, $C\leq D$. Both capacity $C$ and demand $D$ are expressed in terms of the chosed EDP.
Algorithm
Example
Reference
[1]